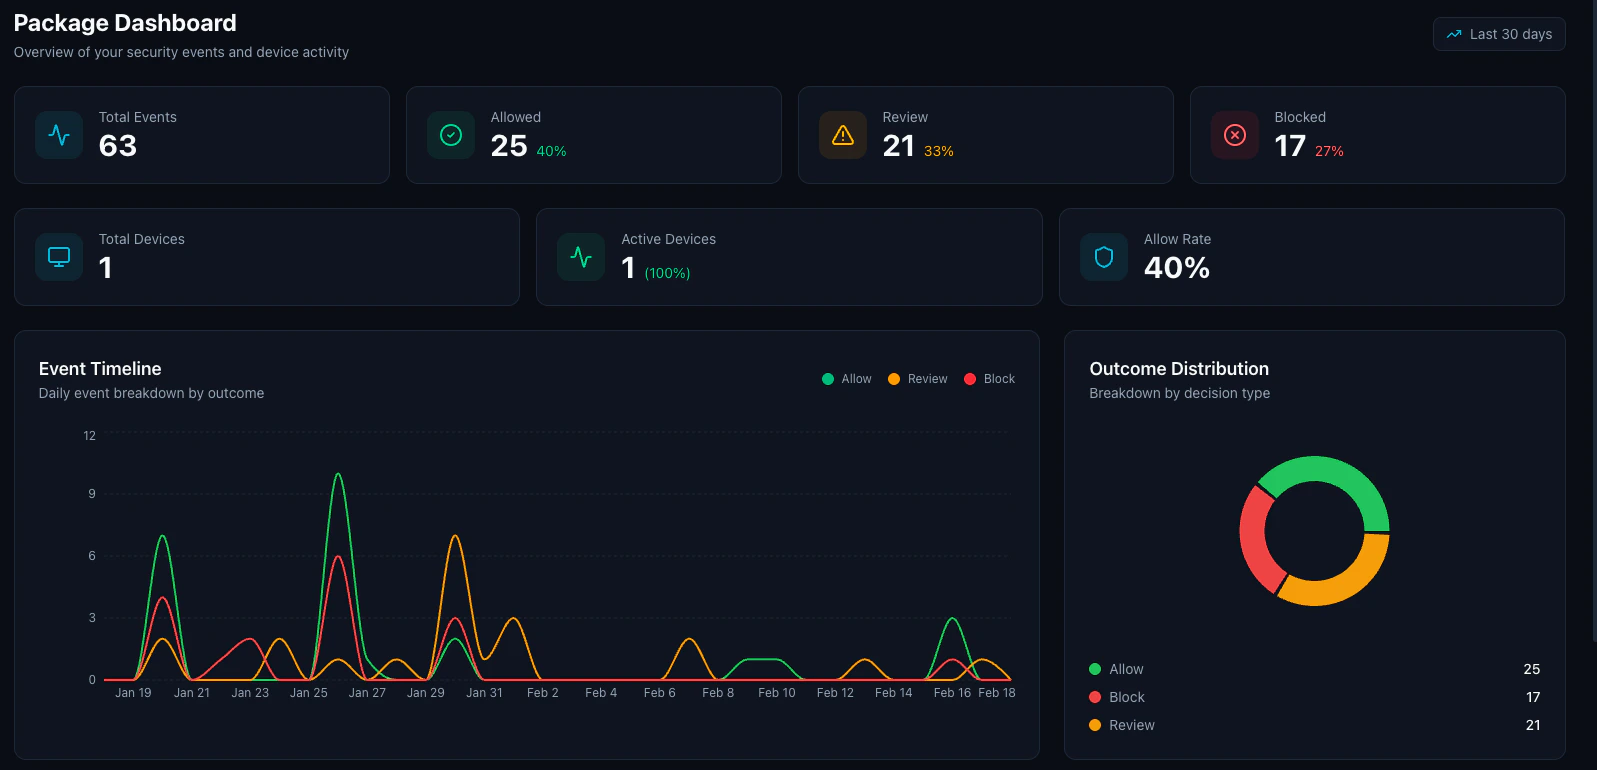
Overview Metrics
At the top of the dashboard, you’ll see four aggregate counts:- Total Events: Total package install evaluations (click to jump to events)
- Allowed: Number of packages that passed all policy checks, with percentage
- Review: Number of packages flagged for manual review, with percentage
- Blocked: Number of packages blocked by policy, with percentage
- Total Devices: Number of registered devices
- Active Devices: Devices that have checked in recently, with percentage
- Allow Rate: Percentage of packages allowed
Event Timeline
A line chart showing package evaluation trends over time with three series (allow, review, block). Use this to:- Spot spikes in blocked packages that may indicate a supply chain attack
- Track the adoption of new packages across your team
- Monitor how policy changes affect allow/block rates
Outcome Distribution
A pie chart showing how packages were evaluated:| Decision | Meaning |
|---|---|
| Allow | Package passed all security checks and was installed |
| Review | Package was flagged for review based on policy thresholds |
| Block | Package was blocked due to a policy violation |
Top Ecosystems
Cards showing which package managers your team is using, with event counts and progress bars:- npm: Node.js packages
- pip: Python packages
- go: Go modules
- cargo: Rust crates